Hamzah Lubis
ABSTRACT
Rule of Indonesian Republic No. 64, 2010 is
about disaster mitigation in coastal area and small Island. It needs data of
temperature and sea water surface increment. This paper focuses on the ambient
temperature and rate of temperature increment and sea water surface increment
in Province of North Sumatera, Indonesia for the year of 2015.This research
location is in East and West coastal area, Sumatera and coastal Nias island.
The method of sea water surface increment measurement is photo image “coastal
area susceptibility index” for the year of 2008. The research data is presented
in table, graph and narration. The results show that the highest temperature in
East coastal area, West coastal area and coastal Nias island are 31.8 0C,
32.2 0C and 32.2 0C, respectively with province average
temperature is 27.36 0C. The rates of average temperature increment
are 0.54%, 1.87 % and 3.66% for each area. The rates of maximum temperature
increment are 0.25%, 1.89% and 11.3% for each area. The rates of sea water surface increment are
0.395%, 1.88% and 7.48% for each area. The sea water surface increments in 2008
and 2015 are 5-14 mm/year and 14.4-101.76
mm/year, respectively. The highest rate of sea water surface increment in
coastal Nias island is 848%. Based on the data shows that a disaster mitigation
in coastal Nias island is very urgent. 

INTRODUCTION
Indonesia has sea area of 5,800,000 km2
which is connected to 17,480 islands. It has shore line of 95,181 km2
which places Indonesia as the fourth
shore line in the world. The province of North Sumatera is one part of
provinces in Indonesia that has sea area of 10,000 km2, it is 60.5%
of province that is connected 162 small islands with shore line of 1,300 km.
The small islands is 6 islands in East shore nd 156 islands in West shore ,
North Sumatera (1). The shore and small islands are susceptible to
occur a disaster. It is due to a climate change (2). The climate
change occur because a global warming up.
It is due to the effect of green house gas. The big number of green
house gas is produced by human works. One part of climate change effect is
increasing of the world temperature. It affects the sea water surface
increment. The effect of sea water surface increment is that the shores and
shore cities will be under water and it is followed by the other multiple
effects. Thus, the sea water surface increment is to be one part of main
environment issue.
LITERATURE REVIEW
Level of GWP
|
Life Time (year)
|
GWP Based on Life Time
|
||
20 years
|
100 years
|
500 years
|
||
Methane
|
12
|
72
|
25
|
7.6
|
Di nitrogen oxide
|
114
|
310
|
298
|
153
|
HFC-23 (hydro fluorocarbon)
|
270
|
12,000
|
14,800
|
12.00
|
HFC-134a (hydro fluorocarbon)
|
14
|
3,830
|
1,430
|
435
|
Sulphur hexafluoride
|
3,200
|
16,300
|
22,800
|
32,600
|
Tetra flour methane
|
50,000
|
5,210
|
7,390
|
11,200
|
Nitrogen tri fluoride
|
740
|
12,300
|
17,200
|
20,700
|
The gas emission of GHG always
increases. Since 1850 to 2011, it increases by multiplier of 163. The increment rate of GHG is not
promotional to the population rate ( 7 times) of 1.2 billion to be 7
billion. The CO2 global
emission in 1850 was only 198 Mt, it increases directly in 1890, 1930, 1970 and
2011 to be 1,304 Mt, 3,855 Mt, 14,531 Mt and 32,274 Mt, respectively. If there
is no effort to decrease the gas emission, thus the earth has only around 485
Pg-C and will be empty in 2045 (4). The gas emission of GHG in
Indonesia (20150 without a calculation of forest fire and field is 37.17 Gt
that it is equivalent to CO2 (GTCO2e) or 1.45 % of the global gas
emission of GHG. By calculating the emission of forest fire and field, the
emission in Indonesia is to be 3 % of
the global gas emission of GHG.
Global Warming
Some factors which affect to
global warming are; (a) radiation fluctuation of sun electromagnetic wave, (b) distance
change between earth to sun, (c) aerosol phenomenon and cloud in atmosphere,
(d) clear color earth surface and (e) effect of green house phenomenon (3).
At the first time, the increment of surrounding temperature was very slow (0.2 0C)
from the year of 1000 to early century of 19. The increment of temperature
increase to be 0.35 0C (in 1910 -
1940) and 0.55 0C (in 1940 – 2000) (3). The
highest surface temperature at North cross has been recorded was 56.7 0C
in Furnace Greek, Greenland, California, America on 10th July
1913, in South cross was 50.7 0C
in Oodnadatta, Australia. The
increment of surrounding temperature, if there is no reduction of emission is
to be 4 0C to 5 0C in 2100. To restrain the temperature increment rate,
panel of government for climate change of United Nation has decided scenario of
safety temperature increment of 2 0C in 2100. The increment rate of global
temperature (5) and regional (6) are shown in Figure 1
and Fig 2.

Figure-1. Increment rate of global temperature

Figure-2. Temperature increment in Nort Sumatera
Sea Surface Increment
The global warming has triggered the ice liquefaction in pole region and affects the sea water
surface increment (3). The best scenario is to restrain the maximum
temperature increment of 2 0C as decision of the United Nation
in Konpenhagen, Denmark in2009 (4).
If the scenario is not run, thus the sea water surface increment will increase
drastically. The United Nation in 2013 estimate that the sea surface increase
30-200 cm (7) and the other modelling predicts that the increasing
is 1,140 cm in 2100. The best scenario figure of sea water surface increment (4)
as shown in Figure 3.

Figure
3 Scenario of sea surface increment
RESEARCH METHODOLOGY
This research focuses on the
increment level of sea water in cities of shore, North Sumatera Indonesia. This
research is worked in 2015 and located on 30 observation points in cities of
shore and small island, North Sumatera, Indonesia. It is categorized in three
groups, the first one is East coastal area, Sumatera island, the second one is
West coastal area, Sumatera island, and the last one is coastal Nias island.
Ten cities and islands are observed for eEach group. The location map is shown
in Figure 4.
 Figure 4 Province of North Sumatera

RESULTS AND DISCUSSION
Temperature
Increment in East Coastal Area
 Figure 5 Temperature graph for Belawan
Figure 5 shows
the temperature increment for ten years. The measurement of minimum temperature
increases from 24.0 0C in 2005 becomes 24.9 0C in 2014
with increment rate of 3.75 % per ten years. It is also for the measurement of
average temperature of 27.9 0C in 2005 becomes 27.95
0C in 2014, it reaches 28.05 0C in 2010. The highest maximum
increment rate is 0.54 % per ten years.
For the maximum temperature of 31.8 0C in 2005
becomes 31.0 0C with trend of reduction is 0.25 % per ten years.
Temperature
Increment in West Coastal Area
 Figure 6 Temperature graph for Pinang Sori
Figure 6 shows
the measurement of minimum temperature that it increases from 21.8 0C
in 2005 becomes 22.2 0C in 2014 with increment rate of 1.83 % per
ten years. It is also for the measurement of average temperature of 26.7 0C
in 2005 becomes 27.20 0C in 2014 with the increment rate is
1.87 %. The maximum temperature of 31.6 0C in 2005
becomes 32.20 0C with increment rate of 1.89 % per ten years.
Temperature
Increment in Coastal Nias Island
 Figure
7 Temperature graph for Binaka
Figure
7 Temperature graph for Binaka
Figure 7 shows
the measurement of minimum temperature that it increases from 21.9 0C
in 2005 becomes 22.7 0C in 2014 with increment rate of 3.65 % per
ten years. It is also for the measurement of average temperature of 25.9 0C
in 2005 becomes 26.85 0C in 2014 with the increment rate is
3.66 %. The maximum temperature of 29.9 0C in 2005
becomes 31.0 0C, it has been in 33.2 0C with increment rate of 11.03 % per ten years.
Sea Surface Increment


East coastal area
|
West coastal area
|
Coastal Nias island
|
||||||
City/ Island
|
Temperature increment (oC)
|
City/ Island
|
Temperature increment (oC)
|
City/ Island
|
Temperature increment (oC)
|
|||
2008
|
2015
|
2008
|
2015
|
2008
|
2015
|
|||
P.Sembilan
|
14.0
|
19.53
|
Barus
|
5.0
|
14.4
|
Tuhemberua
|
12.0
|
101.76
|
Pk. Susu
|
14.0
|
19.53
|
Sibolga
|
5.0
|
14.4
|
Gn.Sitoli
|
12.0
|
101.76
|
Tapak Kuda
|
13.5
|
18.83
|
Pandan
|
5.0
|
14.4
|
Hiliana
|
12.0
|
101.76
|
Belawan
|
13.5
|
18.83
|
P.Mursala
|
5.0
|
14.4
|
T. Dalam
|
12.0
|
101.76
|
Percut
|
13.0
|
18.14
|
Bt.Mundon
|
12.0
|
34.56
|
Sirombu
|
12.0
|
101.76
|
Pt. Cermin
|
13.0
|
18.14
|
Singkuang
|
12.0
|
34.56
|
P.Pini
|
12.0
|
101.76
|
S. Buah
|
13.0
|
18.14
|
Tabuyung
|
12.0
|
34.56
|
P.Tana Masa
|
12.0
|
101.76
|
Pk. Luduk
|
12.5
|
17.44
|
Taluk
|
12.0
|
34.56
|
P.Bala
|
12.0
|
101.76
|
Tj. Tiram
|
12.5
|
17.44
|
Natal
|
12.0
|
34.56
|
P.Simuk
|
12.0
|
101.76
|
S.Pt. Pukat
|
12.5
|
17.44
|
Batahan
|
12.0
|
34.56
|
P. Wunga
|
12.0
|
101.76
|
Based on the Table 2 that the lowest sea
water surface increments are around
Barus, Sibolga, Pandan and Mursala island, they are 5 mm/year. The sea
increment level in the four locations include in the lowest increments in some
locations in Indonesia. The sea water increment level in East coastal area, North
Sumatera gives a trend that it goes to North from 12.5-14 mm/year and coastal
Nias island is 12 mm/year. The sea water surface increment in 2015 in the West
coastal area and East coastal area are from 14.4 mm to 34.56 mm, 17.44 mm to
19.53 mm, respectively. Whereas, the sea water surface increment in Nias island
is 101.76 mm with its increment rate is 848 %. The highest sea water surface
increment needs more comprehensive disaster mitigation. A graph og sea water
surface increment in 2008 and 2015 and also the sea water surface increment
rate are shown in Figure 8.
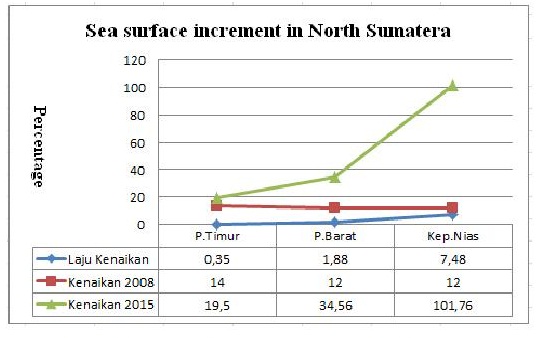
Figure 8 The sea water surface
increment in North Sumatera